
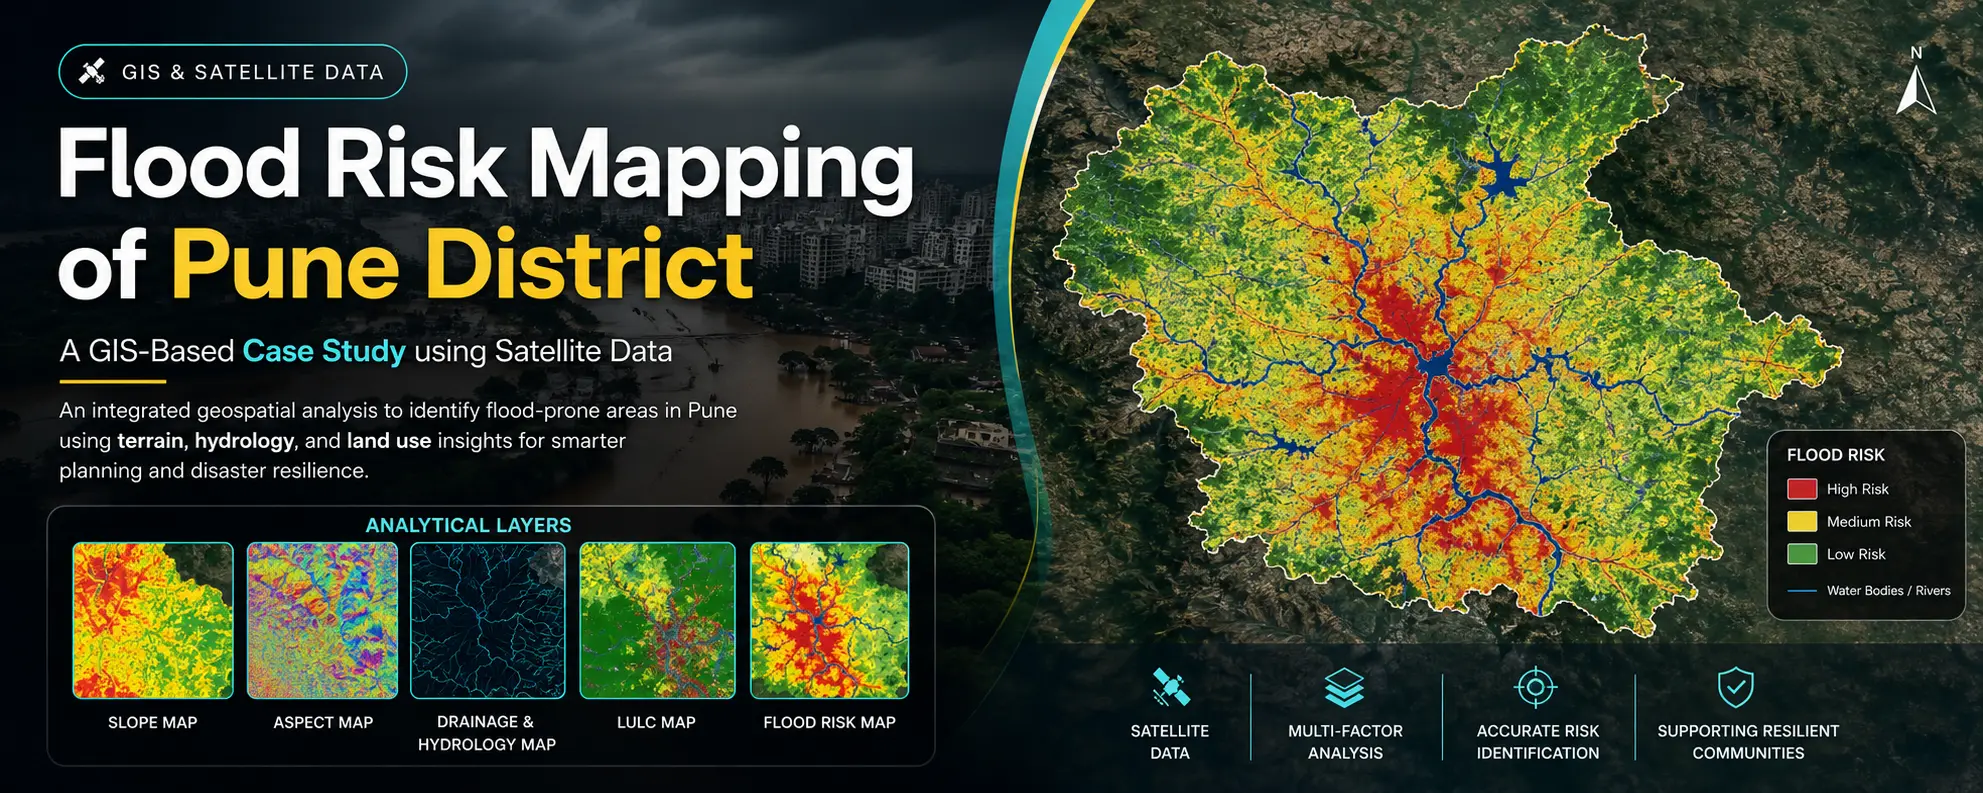
Satellite-Based Flood Risk Analysis of Pune District Using GIS and Remote Sensing
Introduction : -
Flooding has become a recurring challenge in rapidly urbanizing regions like Pune district in Maharashtra. With increasing rainfall variability and uncontrolled urban expansion, identifying flood-prone zones is critical for sustainable planning and disaster mitigation.
This project presents a satellite-based flood risk analysis using GIS and remote sensing techniques, combining terrain, hydrology, and land use data to identify vulnerable areas in Pune.
Problem statement :-
Pune has experienced multiple flood events in recent years, driven by a combination of intense, short-duration rainfall and rapid urban expansion that has reduced natural drainage capacity. The presence of low-lying terrain further increases the likelihood of water accumulation, while inadequate and poorly maintained stormwater management systems exacerbate the situation. Despite these growing challenges, there remains a lack of integrated geospatial analysis that can effectively identify and map flood-prone zones across the district, limiting the ability of planners and authorities to take proactive mitigation measures.
Data Sources : -
This project uses open-source satellite and geospatial datasets:
• Elevation (DEM): USGS
• Land Use / Land Cover (LULC): Copernicus Programme
• Administrative Boundary: Pune district shapefile (open GIS sources)
These datasets are widely used in geospatial analysis and are freely available for research and development.
Methodology : -
The flood analysis was carried out using GIS-based multi-factor modeling. The following maps were generated:
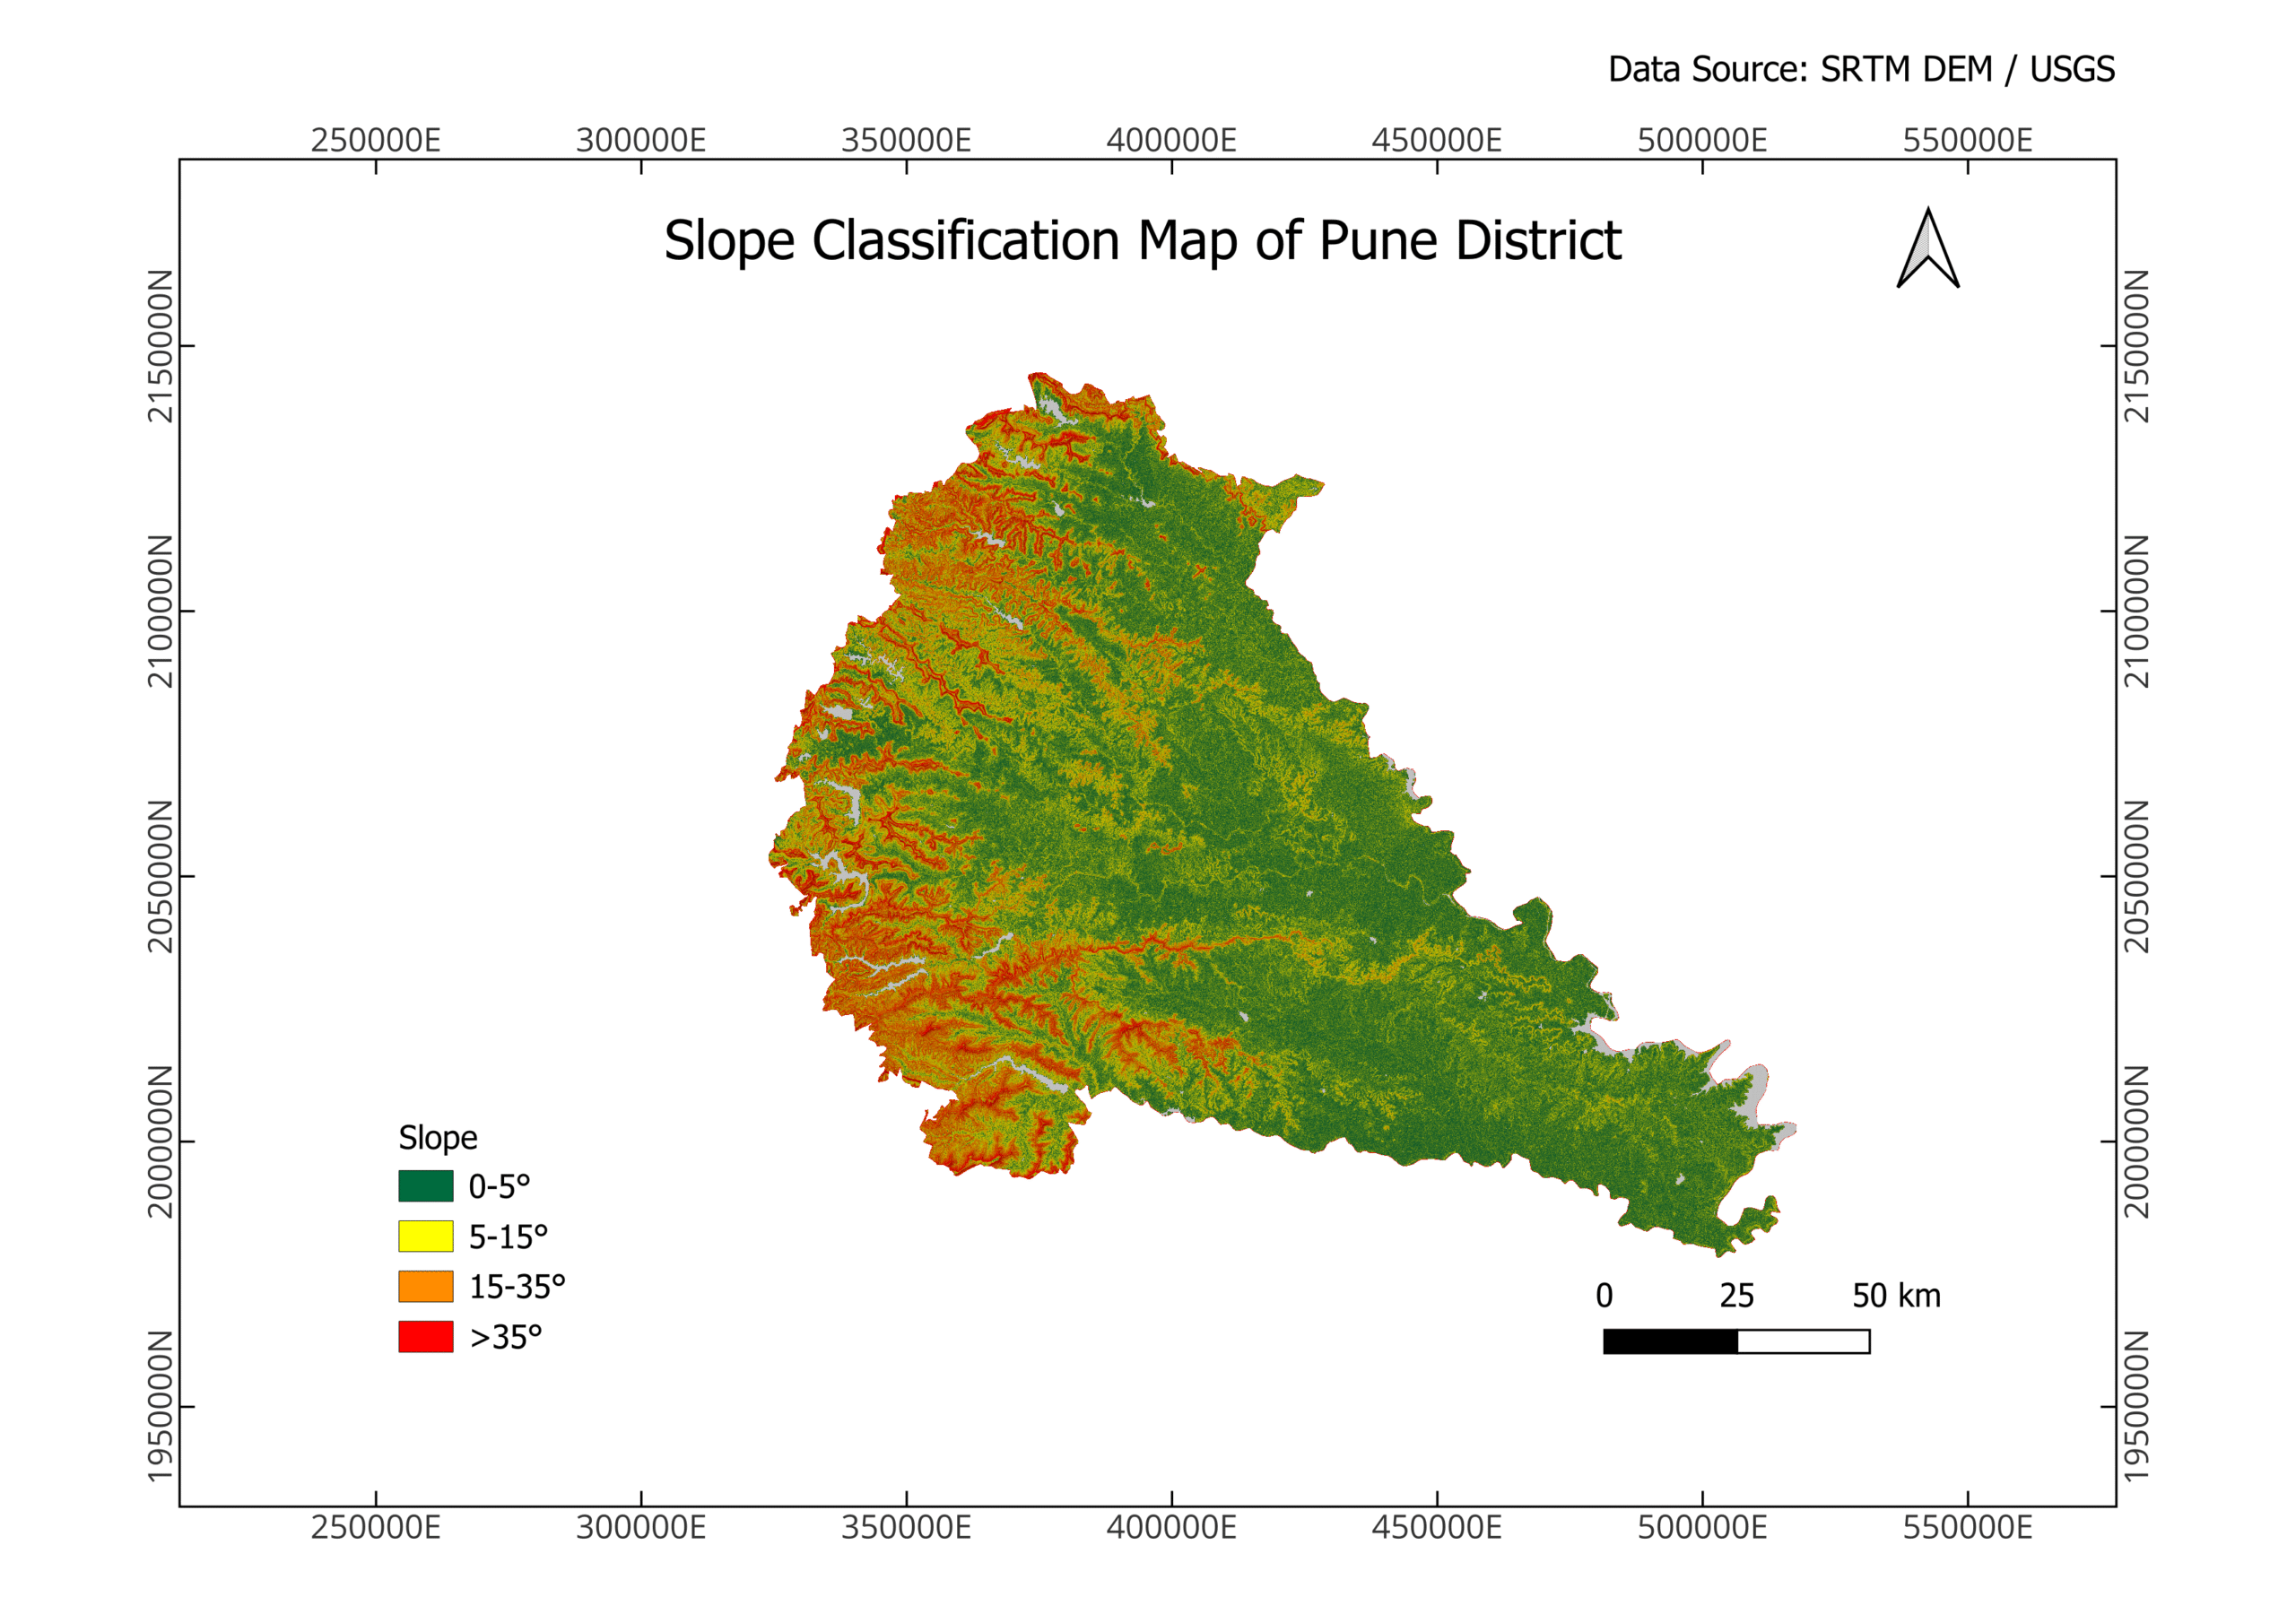
1. Slope Map Analysis - :
The slope map represents the rate of elevation change across the Pune district. It plays a crucial role in determining how water flows over the terrain.
• Areas with low slope (flat terrain) tend to accumulate water, increasing flood risk.
• Regions with steep slopes allow faster water runoff, reducing flood potential.
The analysis shows that several low-slope regions in Pune are more vulnerable to waterlogging during heavy rainfall events.
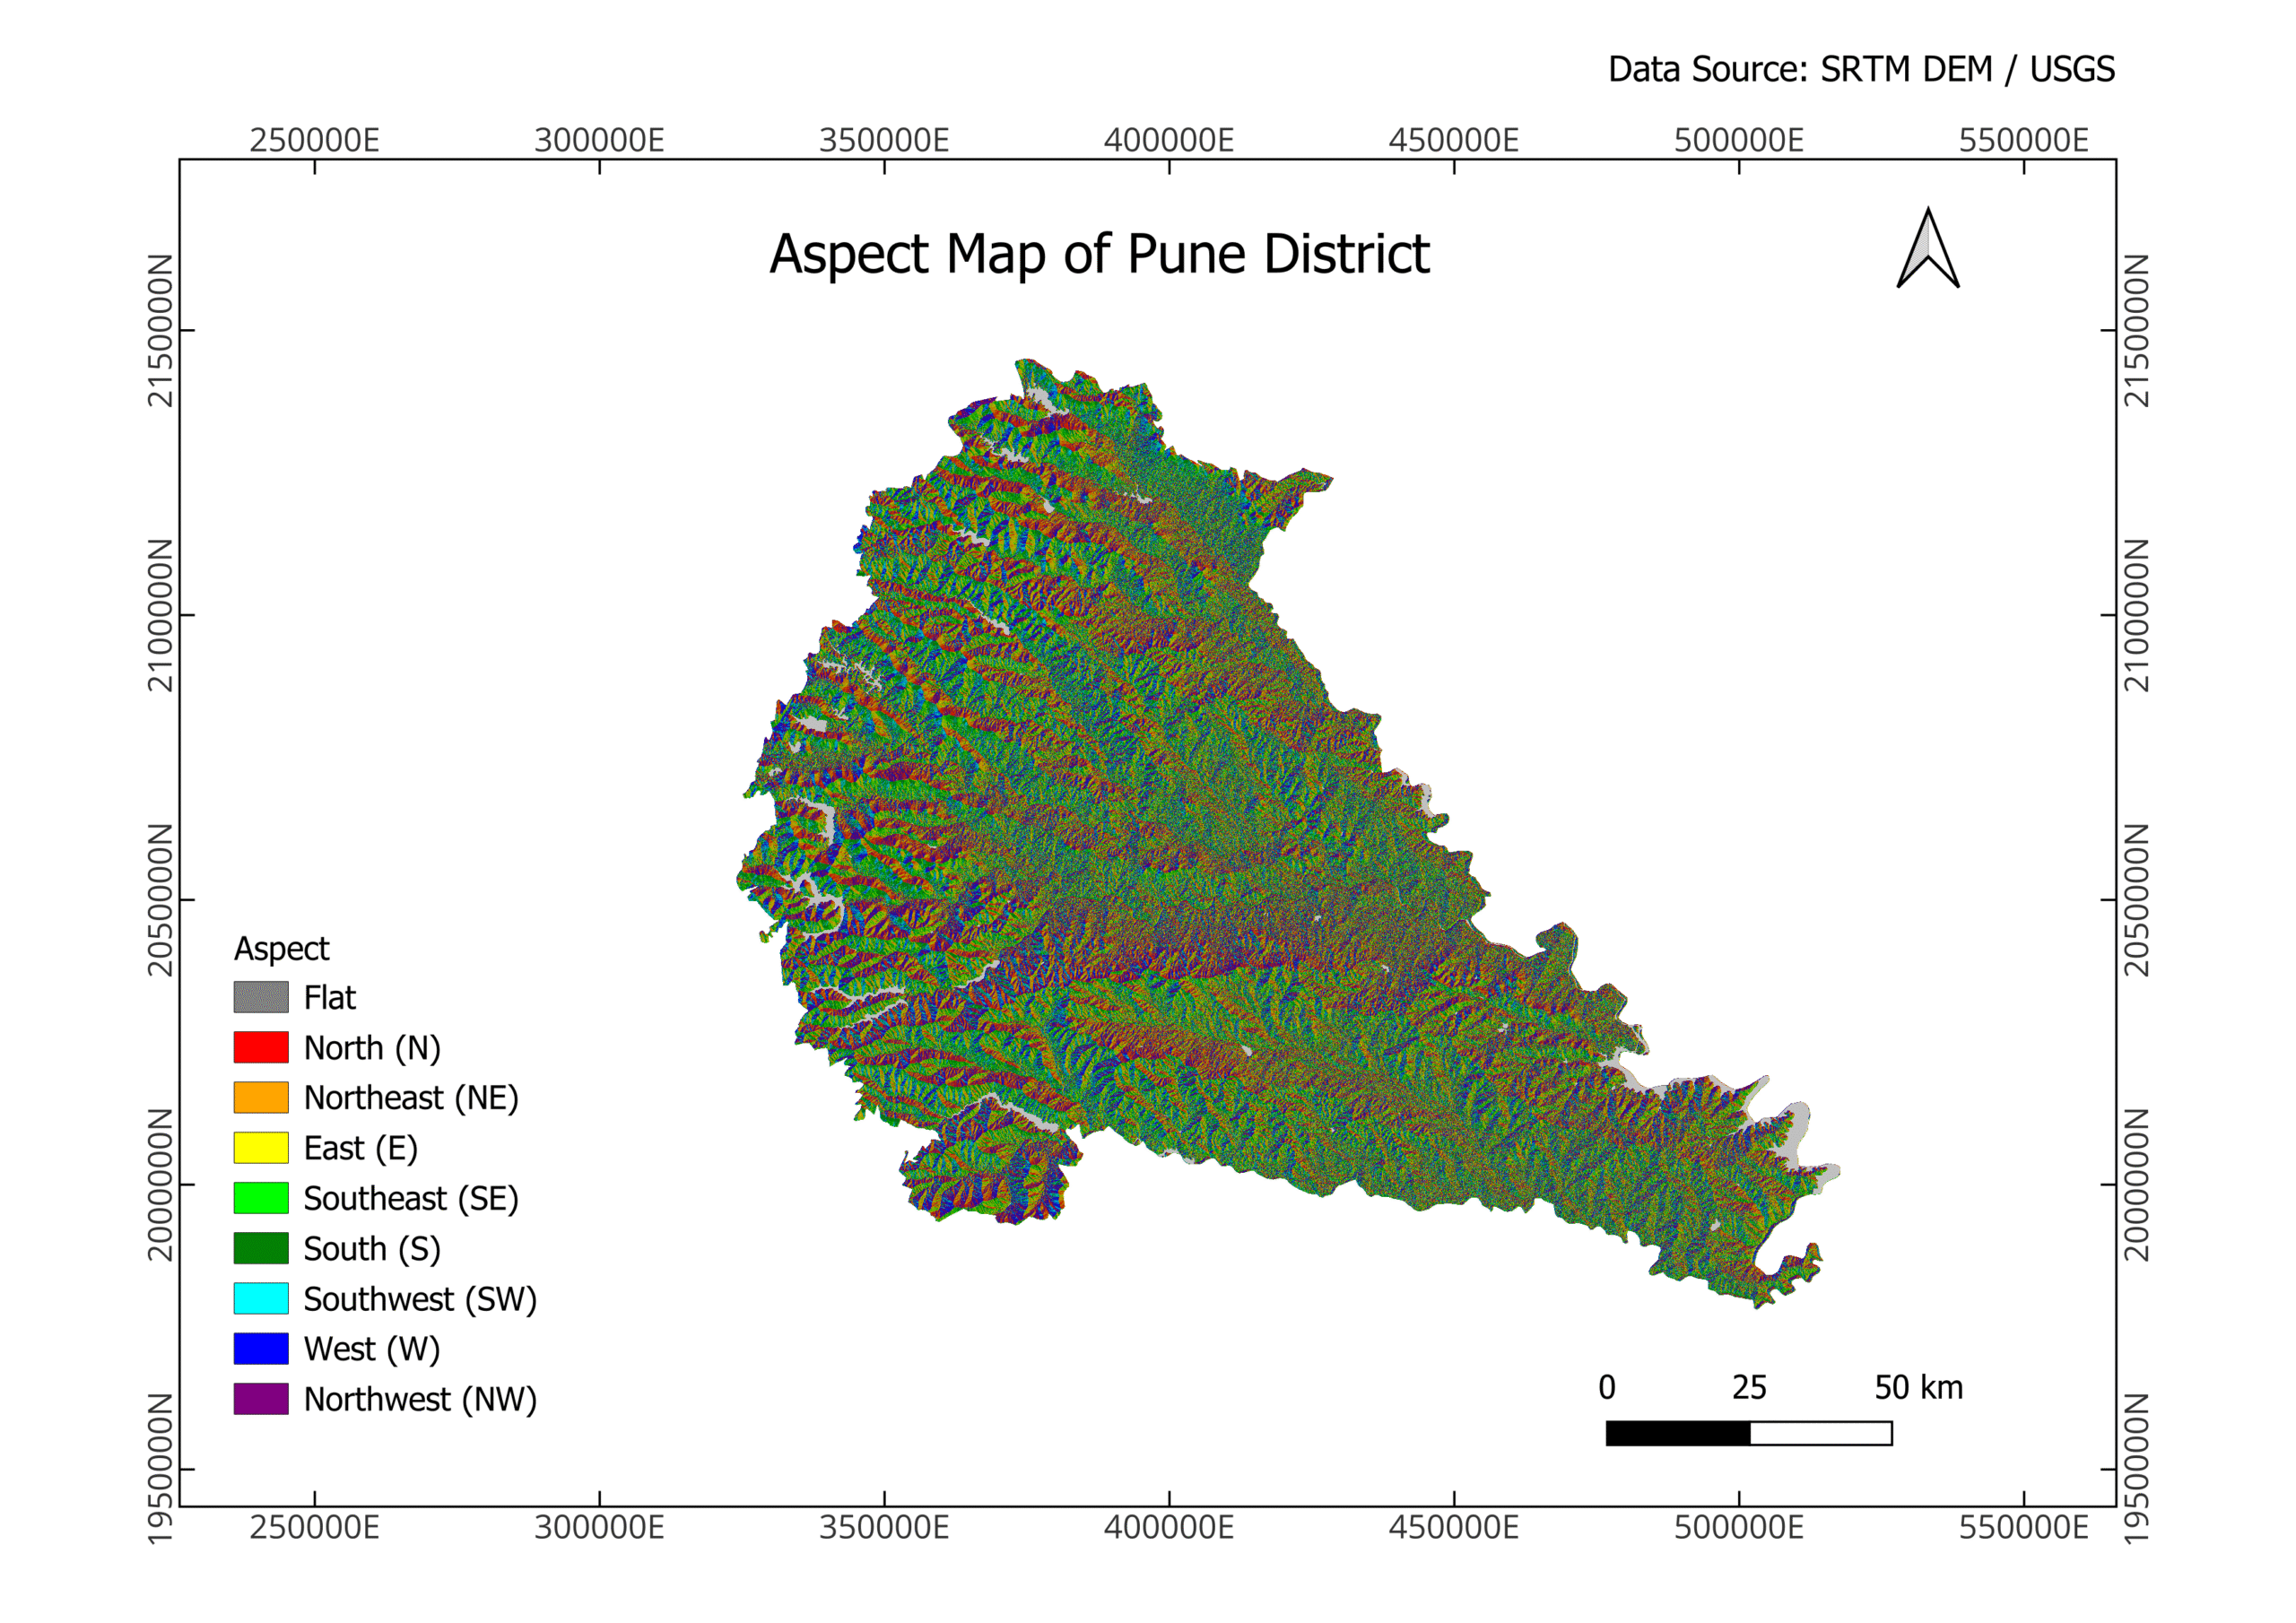
2. Aspect Map Analysis : -
The aspect map indicates the direction of slope, which influences water movement and drainage patterns.
• Certain slope directions may lead water toward specific basins or low-lying zones.
• Helps in understanding directional flow of runoff.
Although not a direct flood indicator, aspect supports hydrological understanding when combined with slope and elevation.
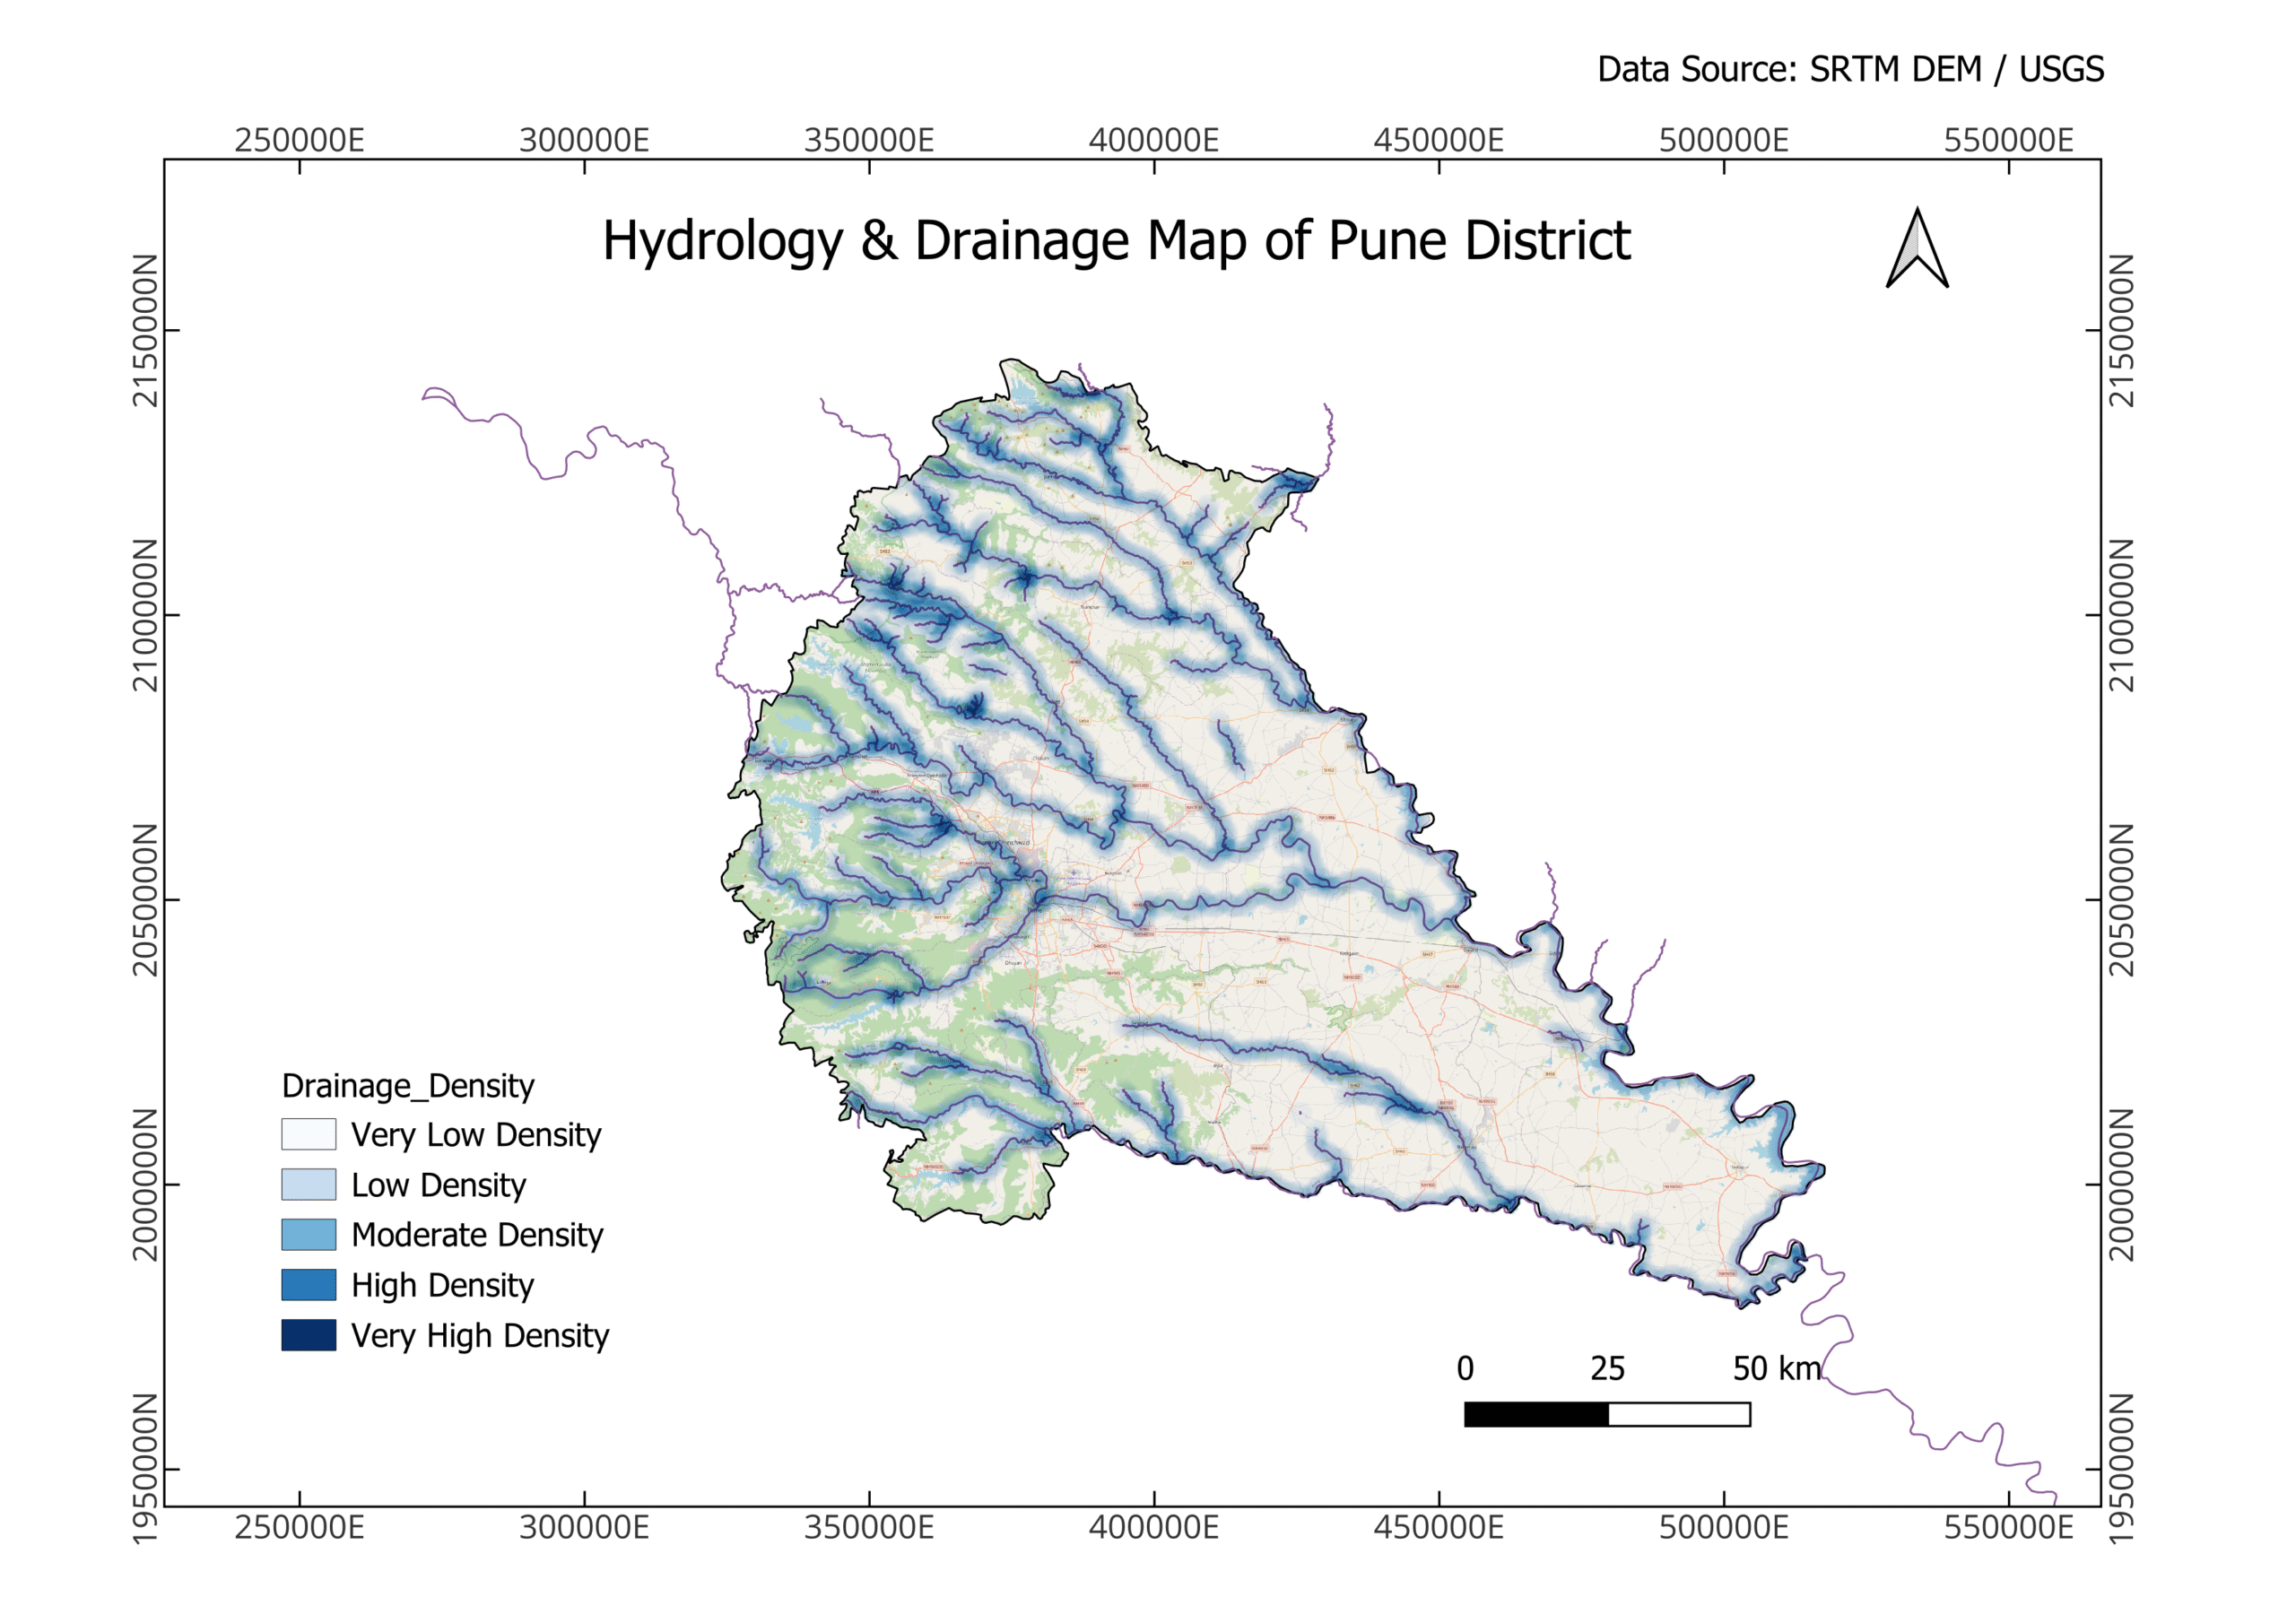
3. Drainage & Hydrology Map Analysis : -
This map identifies natural drainage networks and water flow channels within Pune.
• Areas near drainage lines are highly susceptible to flooding during heavy rainfall.
• Poorly connected or blocked drainage systems increase flood intensity.
The hydrology analysis highlights zones where water naturally accumulates, making them critical flood-prone areas.
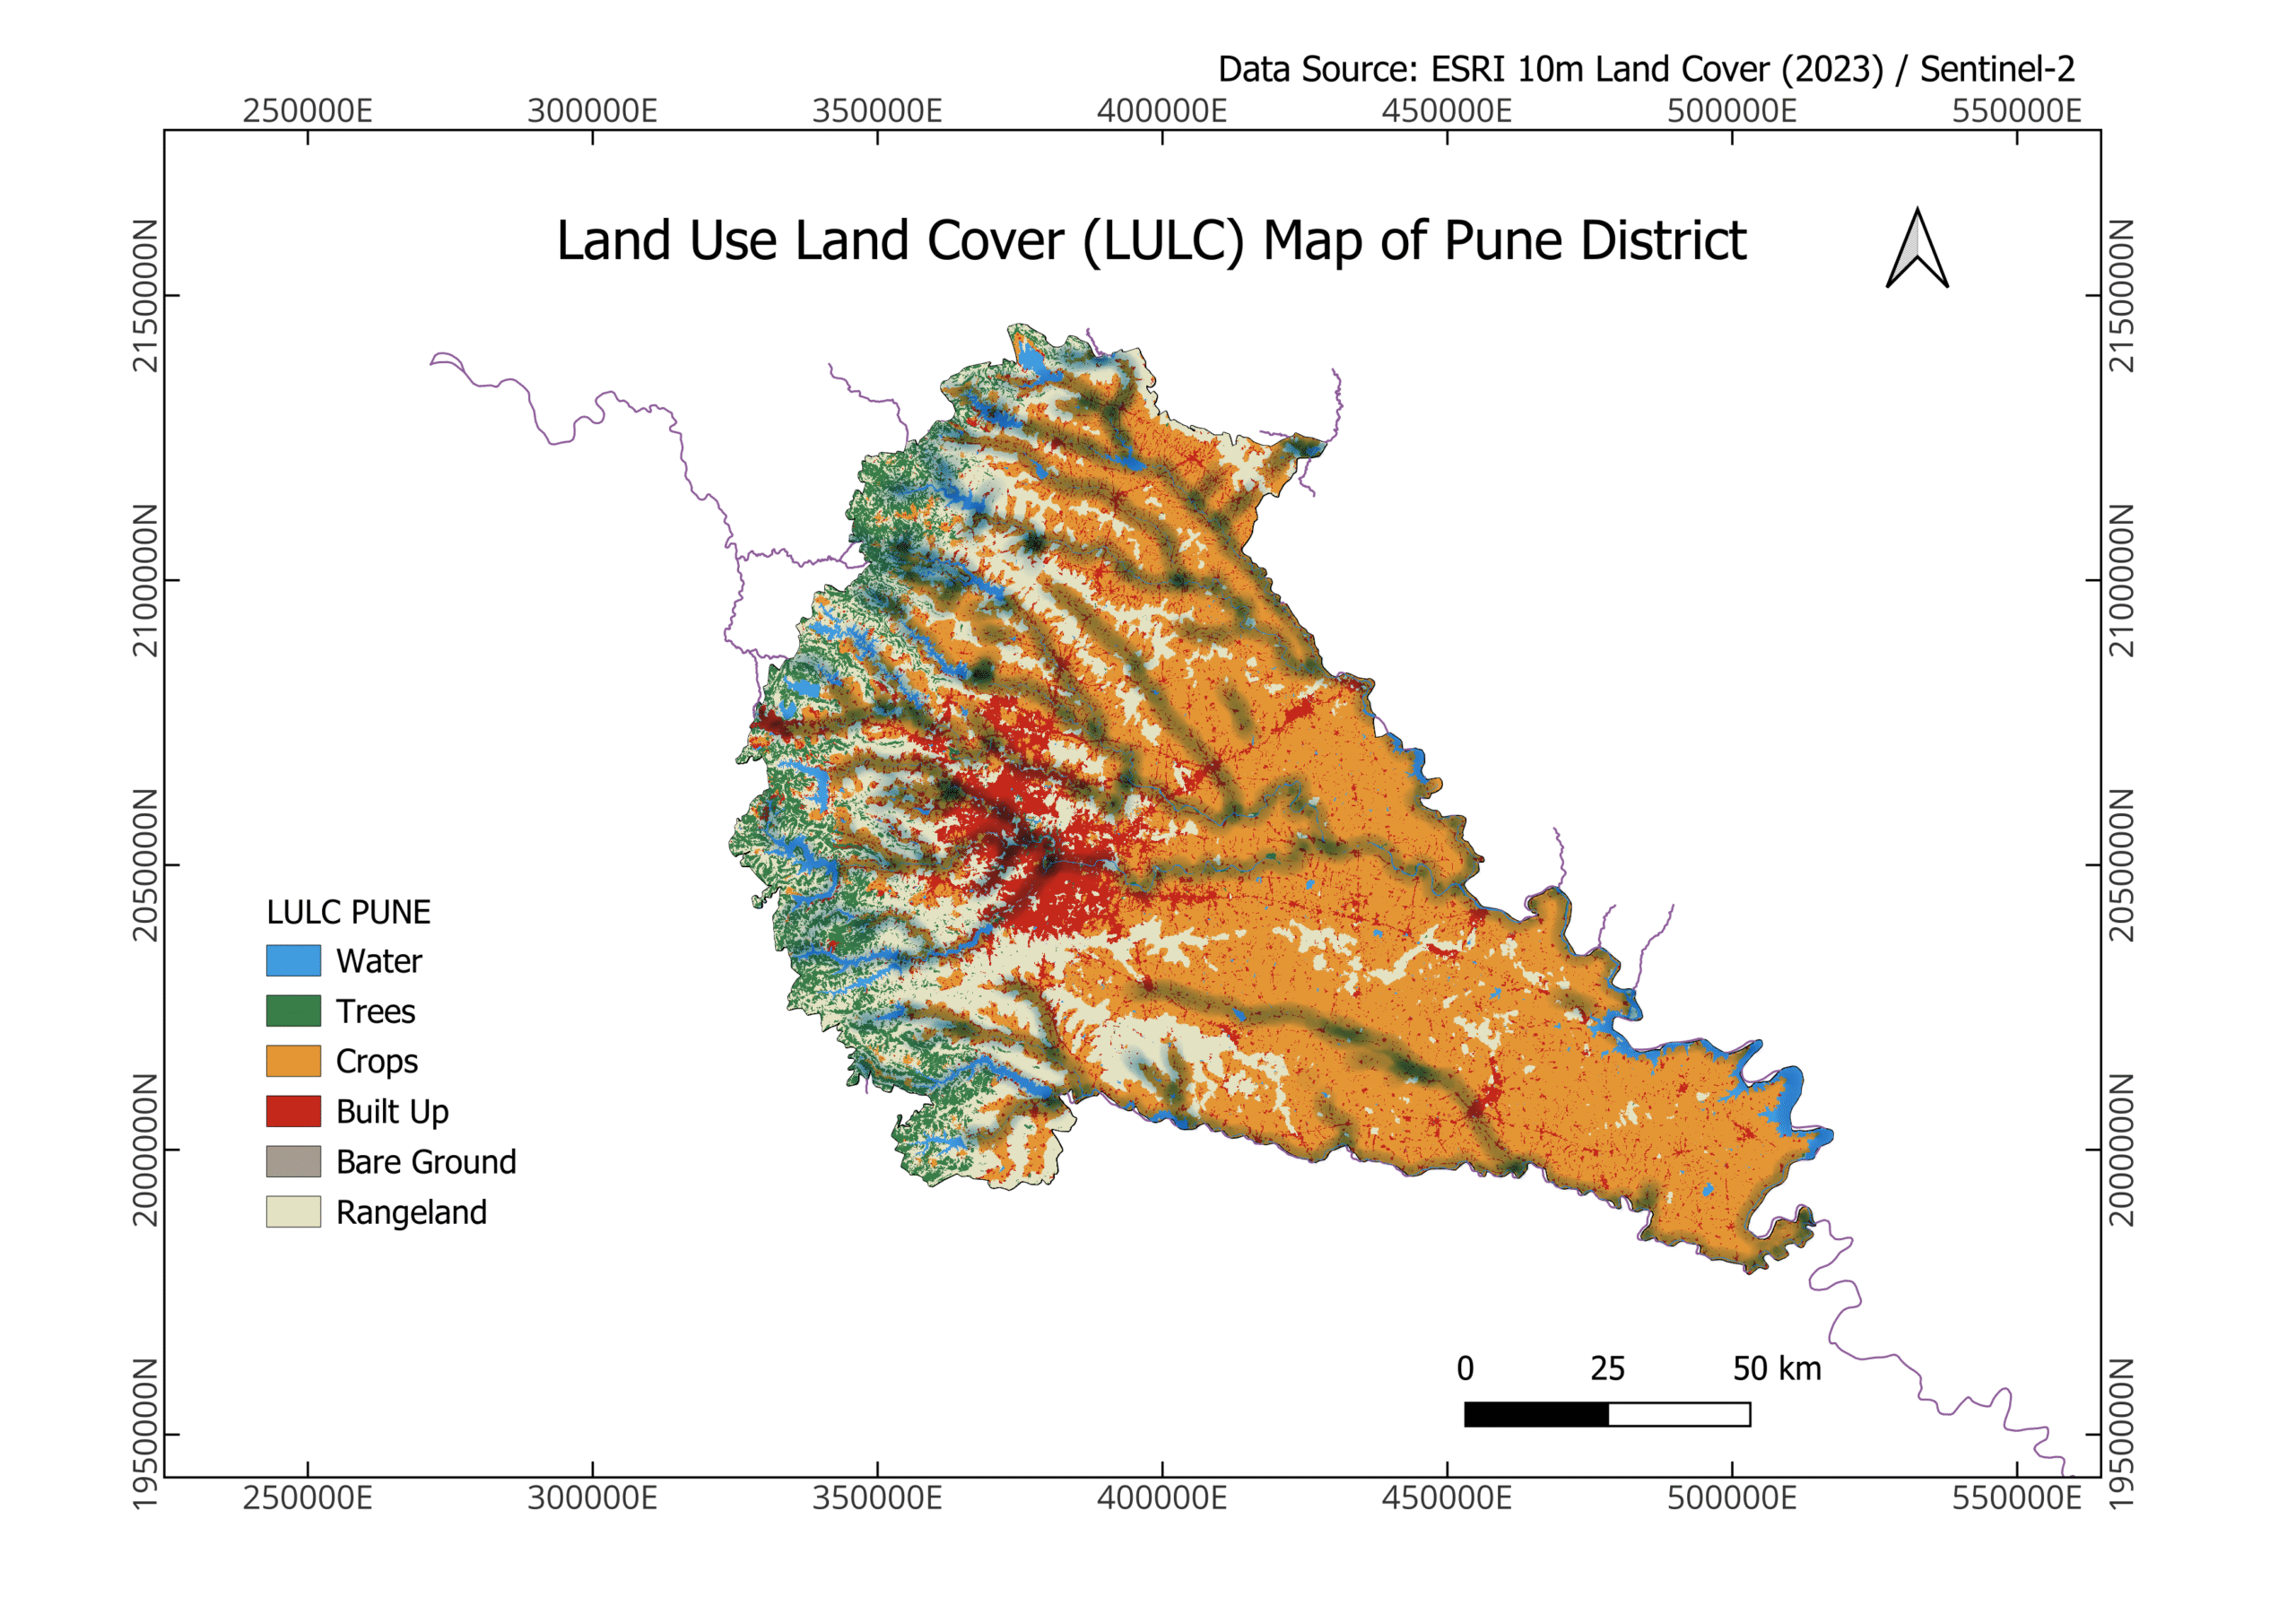
4. Land Use / Land Cover (LULC) Analysis : -
The LULC map categorizes land into different classes such as urban, vegetation, and water bodies.
• Urban areas show high flood risk due to impermeable surfaces.
• Vegetation and agricultural lands help absorb water and reduce runoff.
The attribute table created for LULC helps assign risk values to each land category, improving the accuracy of the flood model.
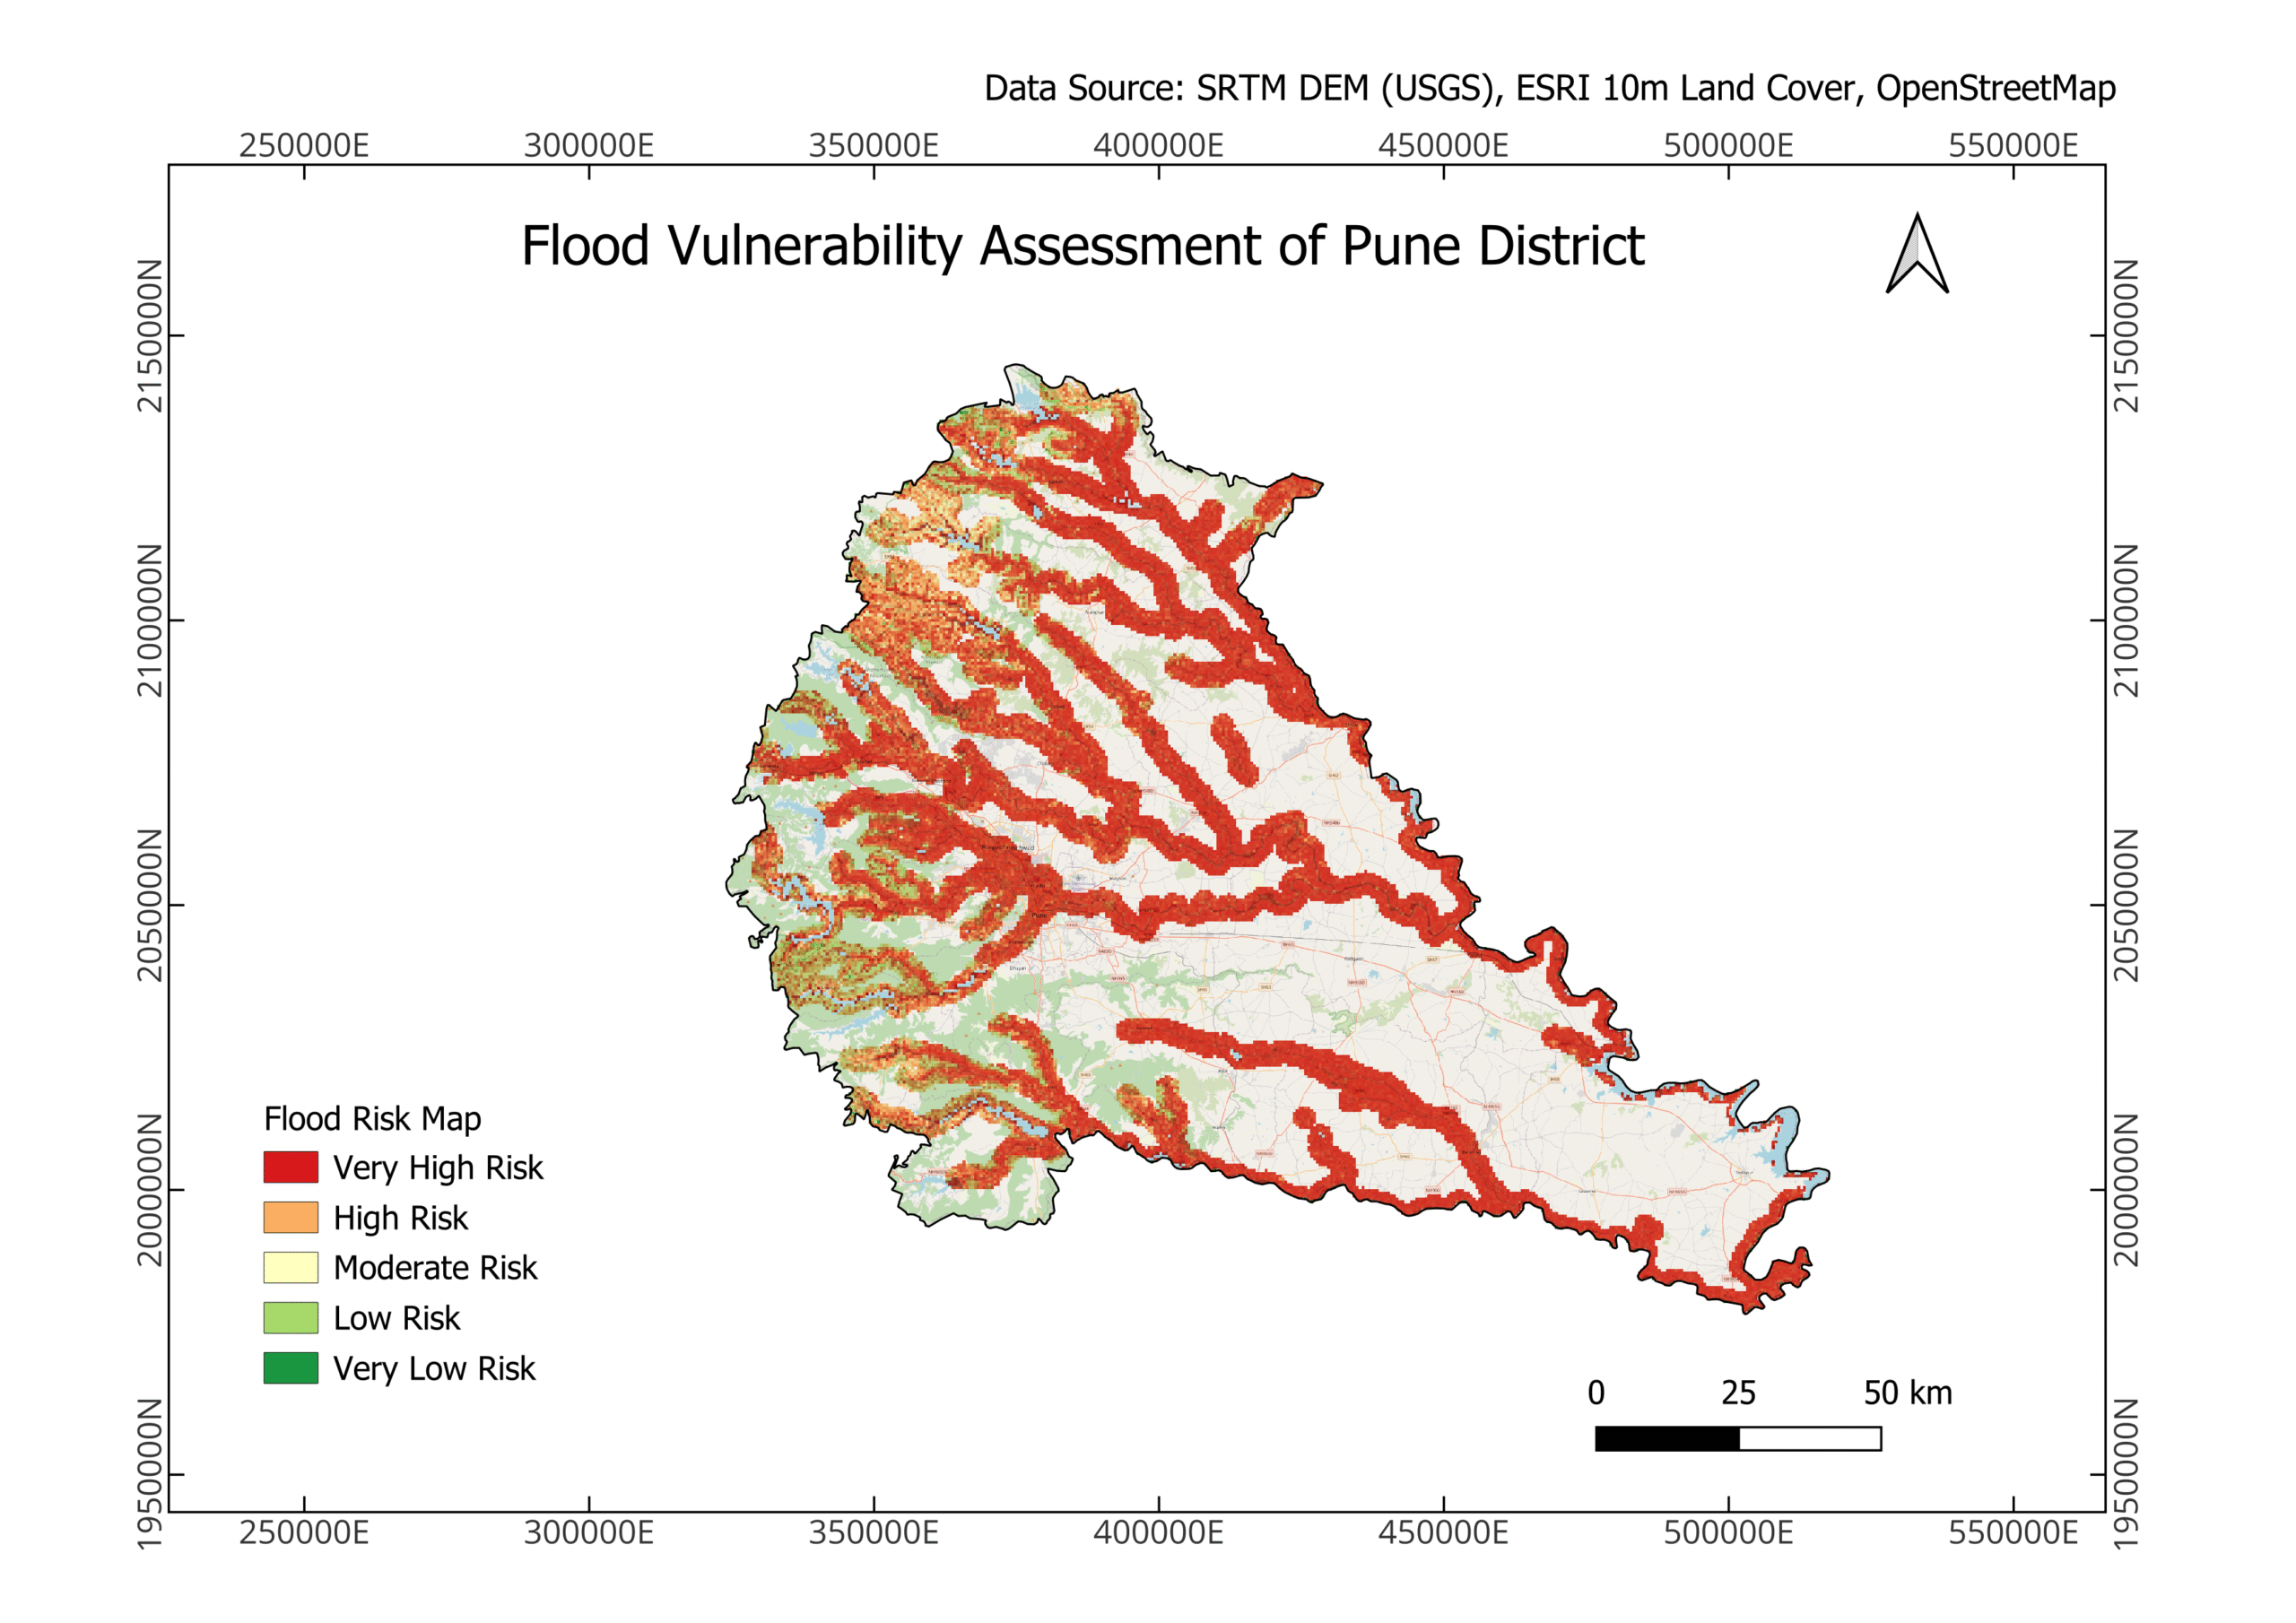
5. Final Flood Risk Map Analysis : -
The final flood risk map integrates all layers using a weighted model.
• High-risk zones are concentrated in low-elevation, flat, and urbanized areas.
• Medium-risk zones represent transitional regions.
• Low-risk zones are typically elevated or vegetated areas.
This map provides a comprehensive overview of flood vulnerability across Pune district.
Solution :-
Detailed Solutions & Recommendations : -
1. Improve Urban Drainage Systems : -
1. Improve Urban Drainage Systems
Urban flooding in Pune is largely influenced by inadequate and outdated drainage infrastructure. Many areas experience waterlogging because stormwater systems are unable to handle high-intensity rainfall events.
To address this:
• Existing drainage networks should be mapped and analyzed using GIS to identify bottlenecks and overflow points.
• Stormwater drains must be redesigned based on terrain slope and flow accumulation patterns, ensuring efficient water movement.
• Regular maintenance and desilting of drainage channels is essential to prevent blockage.
• Smart drainage systems with real-time monitoring sensors can be implemented in critical zones.
👉 Your drainage & hydrology map directly supports this by identifying natural water flow paths and accumulation zones.
2. Restrict Construction in High-Risk Zones : -
Unplanned urban expansion in flood-prone areas significantly increases vulnerability. Many high-risk zones identified in the flood map overlap with rapidly developing urban regions.
Recommended actions:
• Use GIS-based flood risk maps to define no-construction or restricted zones.
• Implement zoning regulations based on flood susceptibility levels.
• Encourage vertical development in safer areas instead of horizontal expansion into low-lying regions.
• Integrate flood risk data into urban planning policies and approvals.
👉 Your final flood risk map becomes a critical decision-making tool for planners and authorities.
3. Increase Green Cover and Natural Absorption : -
Loss of vegetation and increase in impervious surfaces (roads, buildings) lead to higher surface runoff, which contributes to flooding.
Solutions include:
• Promoting urban green spaces, parks, and green corridors to absorb rainwater.
• Encouraging rainwater harvesting systems in residential and commercial areas.
• Protecting existing forests and agricultural lands from urban conversion.
• Implementing permeable pavements to reduce runoff in urban zones.
👉 Your LULC (Land Use Land Cover) map clearly shows how urban areas contribute to higher flood risk compared to vegetated regions.
4. Flood Early Warning Systems : -
Floods can be managed more effectively if early warnings are available. Satellite data plays a key role in monitoring and prediction.
Key improvements:
• Use satellite rainfall data from sources like
NASA Earthdata
to track real-time precipitation patterns.
• Combine rainfall data with terrain analysis to identify high-risk zones before flooding occurs.
• Develop automated alert systems for authorities and citizens.
• Integrate GIS dashboards for continuous monitoring.
👉 Your project demonstrates how satellite + terrain data can be used as a foundation for early warning systems.
5. Sustainable and Flood-Resilient Urban Planning
Long-term flood management requires integrating geospatial analysis into planning and policy decisions.
Recommendations:
• Use GIS-based flood models during city master planning.
• Design infrastructure such as roads, bridges, and buildings considering flood risk zones.
• Develop flood-resilient infrastructure, including elevated roads and drainage systems.
• Encourage collaboration between urban planners, GIS analysts, and environmental experts.
👉 This is where your entire project becomes valuable—it acts as a decision-support system.
Key Findings : -
• Low-lying areas with flat terrain show high flood susceptibility
• Urban regions exhibit increased flood risk due to impermeable surfaces
• Areas near drainage networks are more vulnerable during heavy rainfall
• Vegetation-rich areas show lower flood impact
Analysis & Interpretation : -
This study demonstrates that flooding in Pune is not caused by a single factor but is a result of:
• Terrain characteristics
• Land use patterns
• Hydrological flow
The integration of these factors provides a more accurate representation of flood-prone zones.
Tools & Technologies Used : -
• QGIS (Geospatial Analysis)
• Remote Sensing Data
• GIS Spatial Analysis Techniques
Conclusion : -
This project highlights how satellite data and GIS analysis can be used to identify flood-prone zones in Pune district. By integrating terrain, hydrology, and land use data, it is possible to develop effective flood risk models that support decision-making.
Such geospatial approaches are essential for building resilient and sustainable cities in the future.